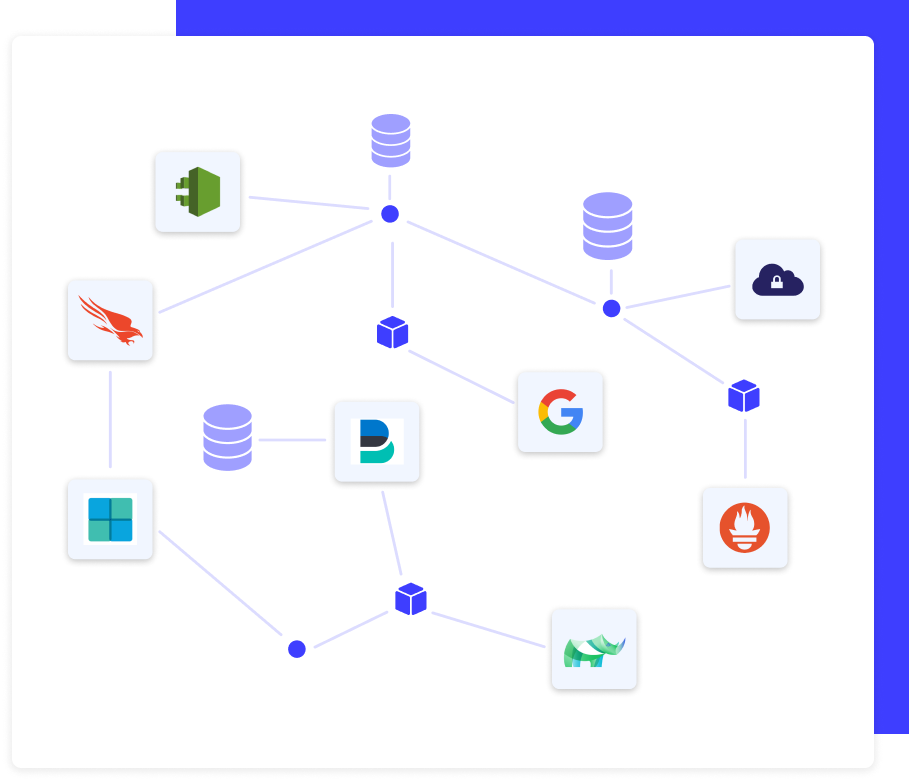
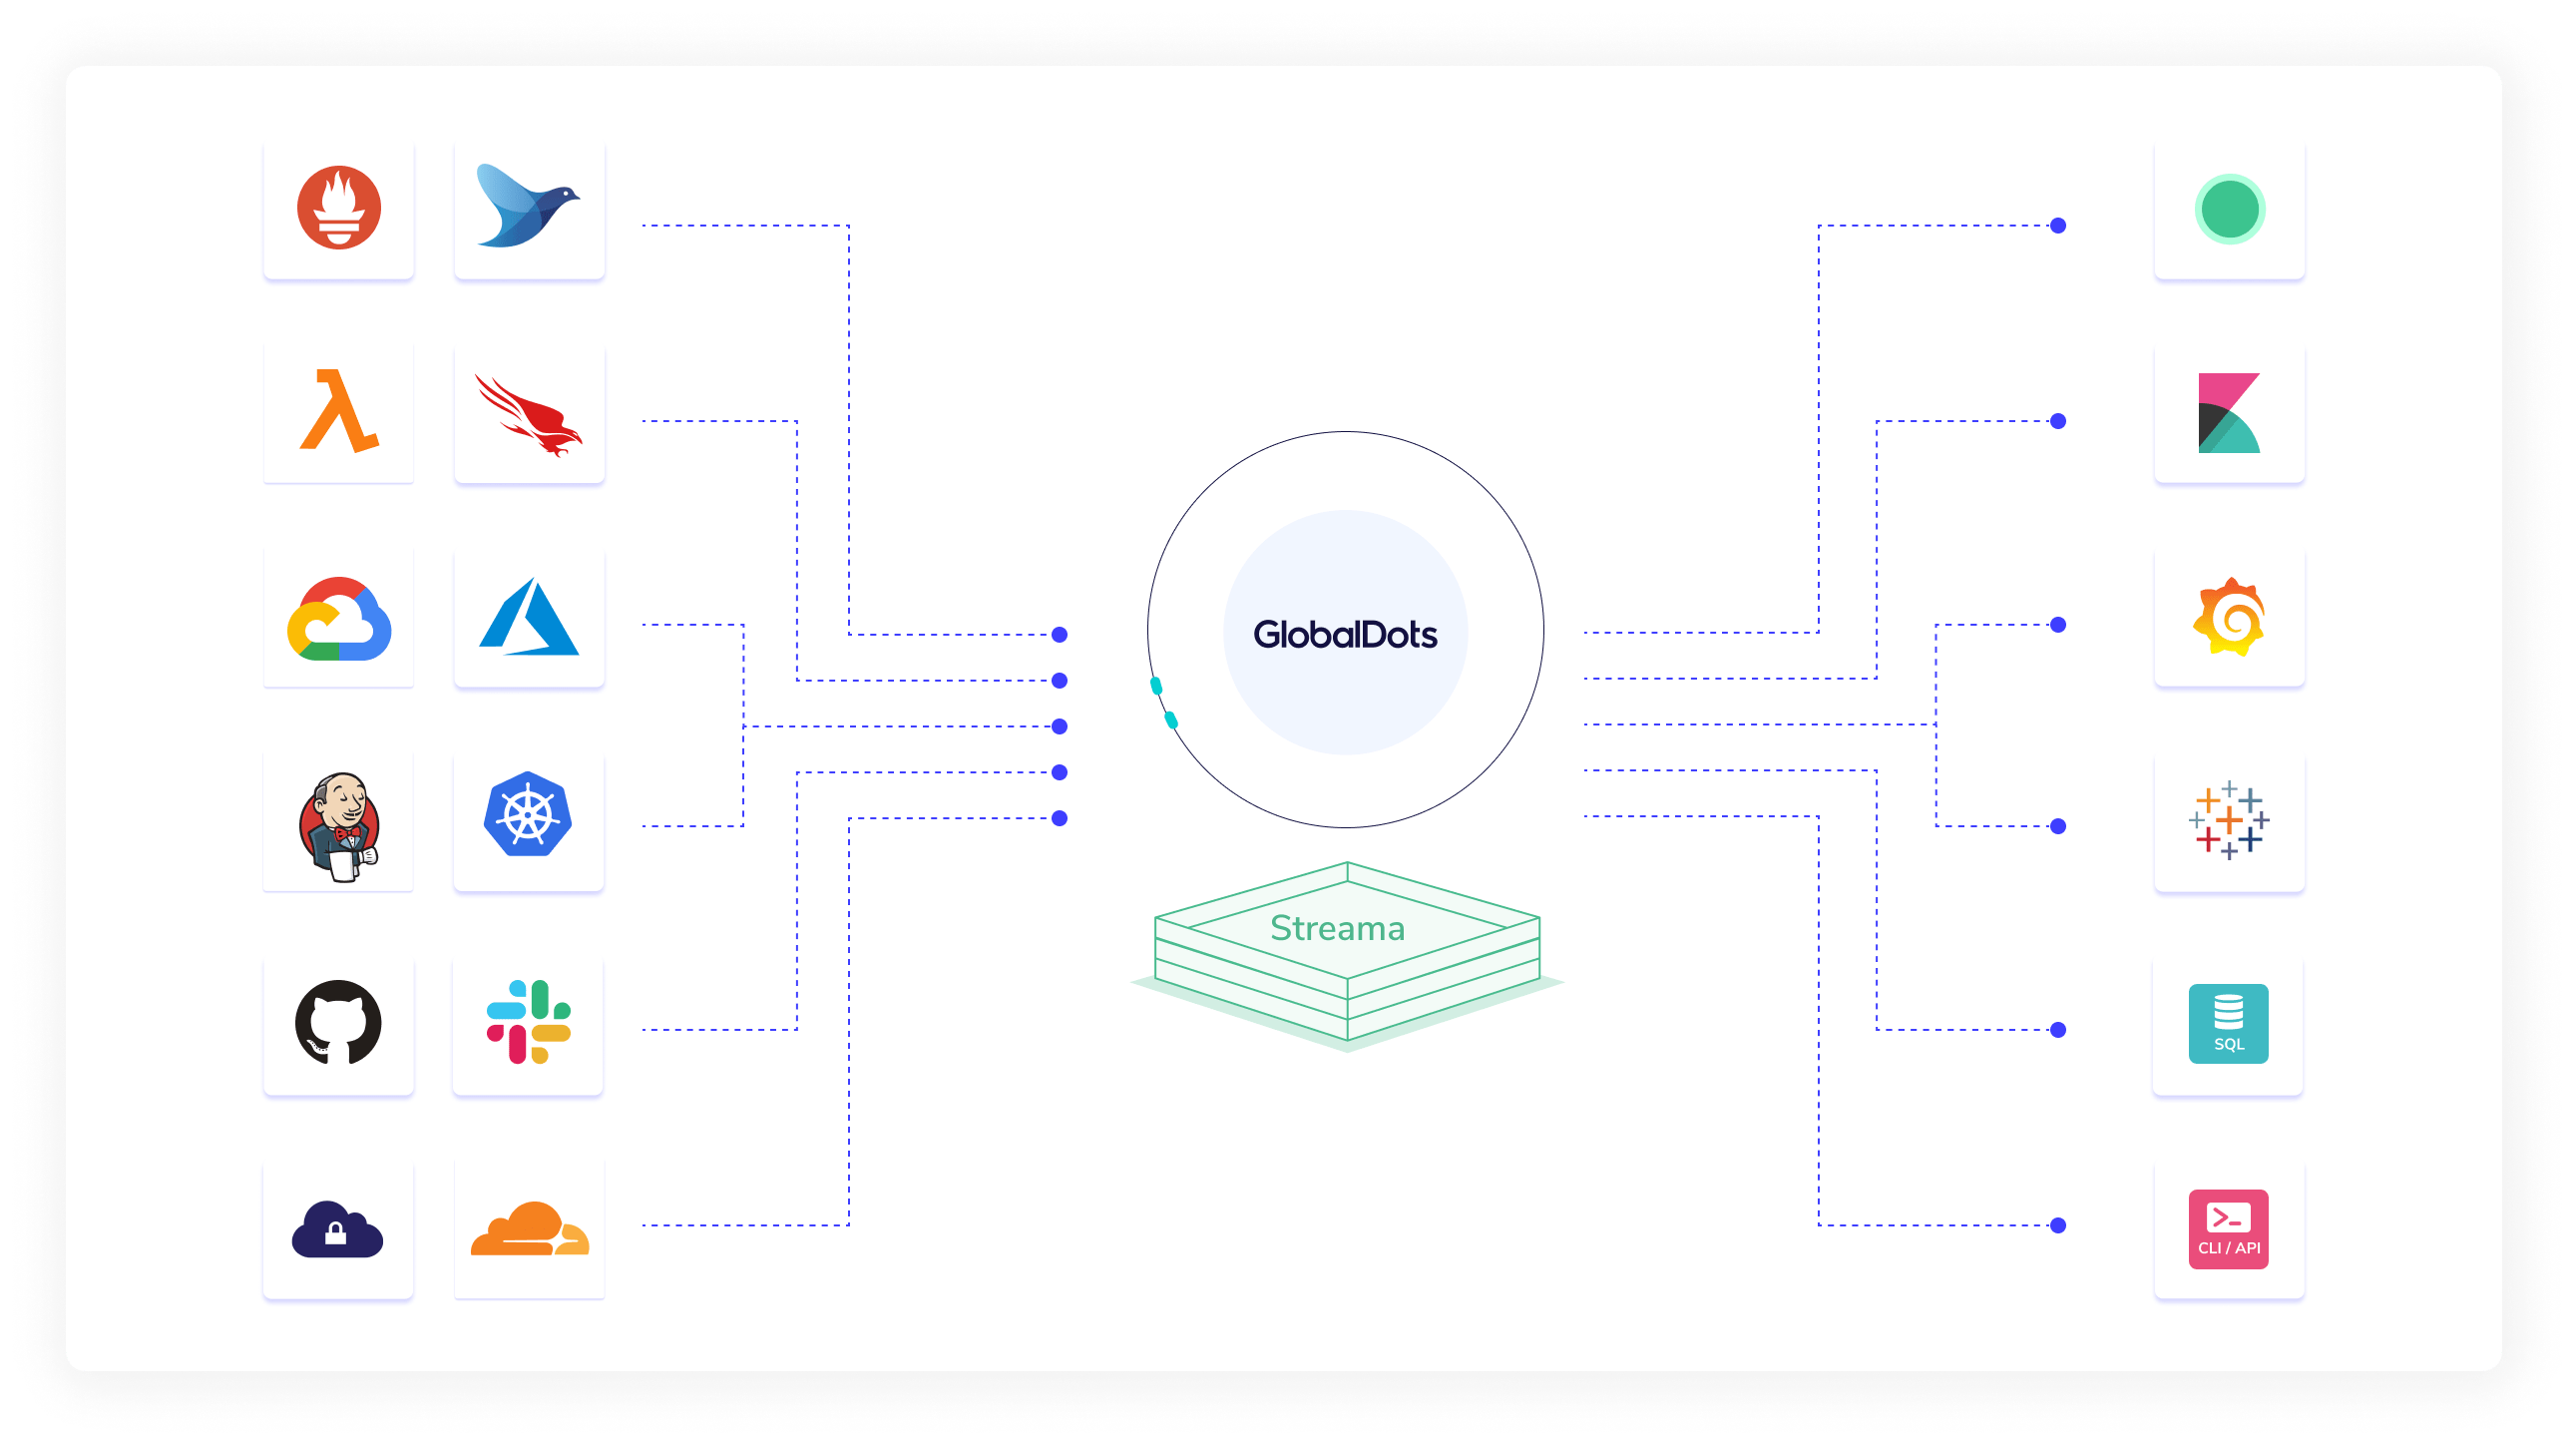
Logs, Metrics & Security Events
Event data is seamlessly collected from hundreds of sources for a single, aggregated view of system health.
Event Source Enrichment
Event enrichment sources are ingested and correlated with event data to ensure that all pertinent information is collected.
Contextual Data Collection
Third-party data sources such as status pages, cloud availability reports, CI/CD platforms & more are leveraged to provide context around how they affect your production.
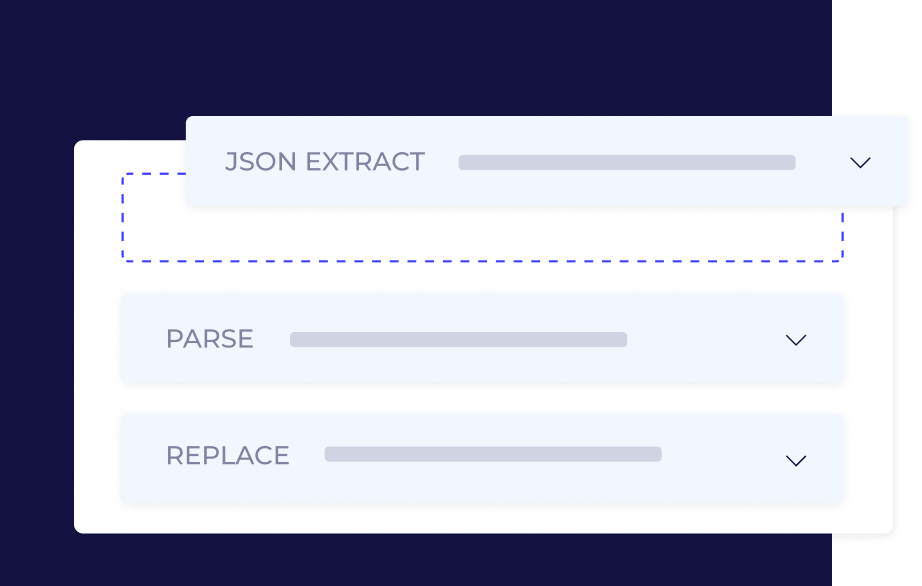
RT Event Transformation
Data is ingested and immediately enters the parsing engine, which executes regex rules to parse, mask, extract or block data without any pre-configurations. Data can then be enriched using pre-built sources or the customer database.
Optimized Storage Routing
Compliance data can be identified and archived at a minimal cost. The rest of the data runs through the monitoring engine and is then sent to archive or to hot storage (only for frequently searched data).
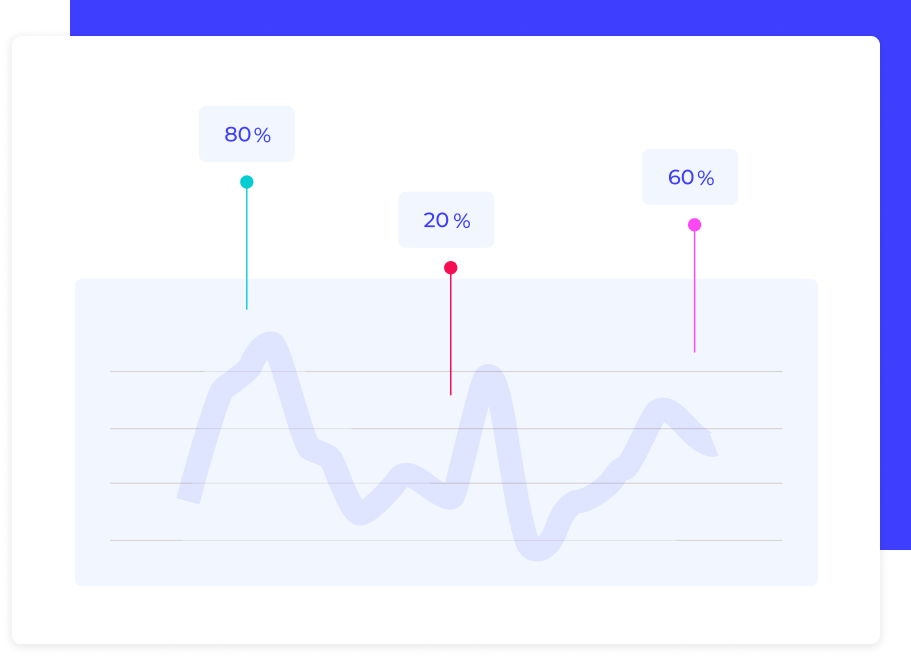
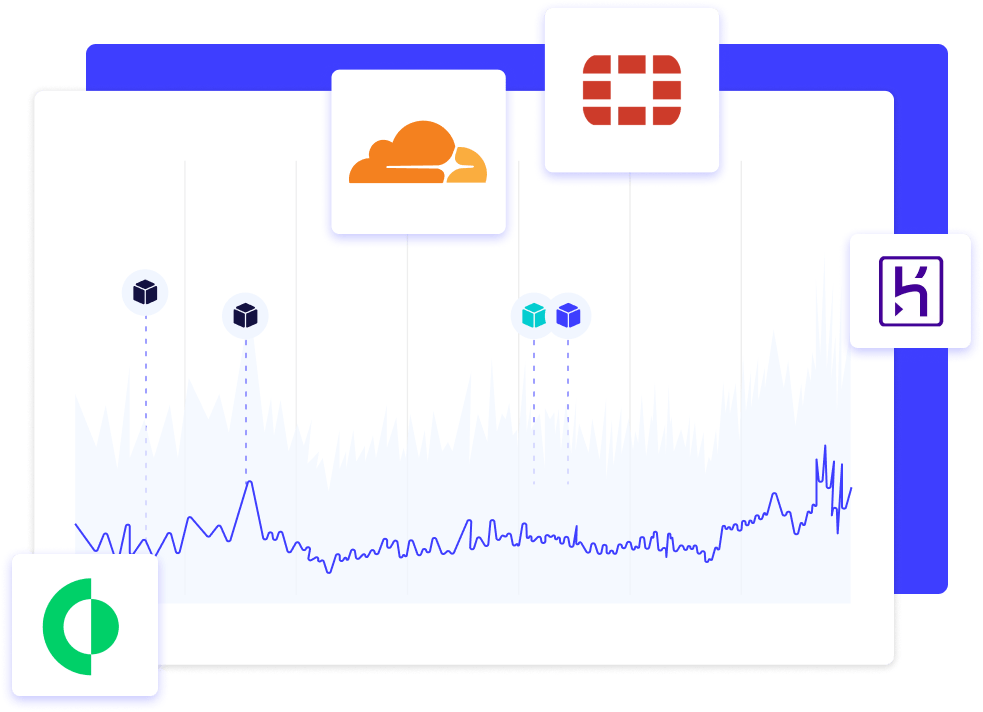
Event Clustering
Machine-learning algorithms cluster countless individual events into a finite number of templates to monitor common events and identify anomalies, including abnormal spikes and log ratios.
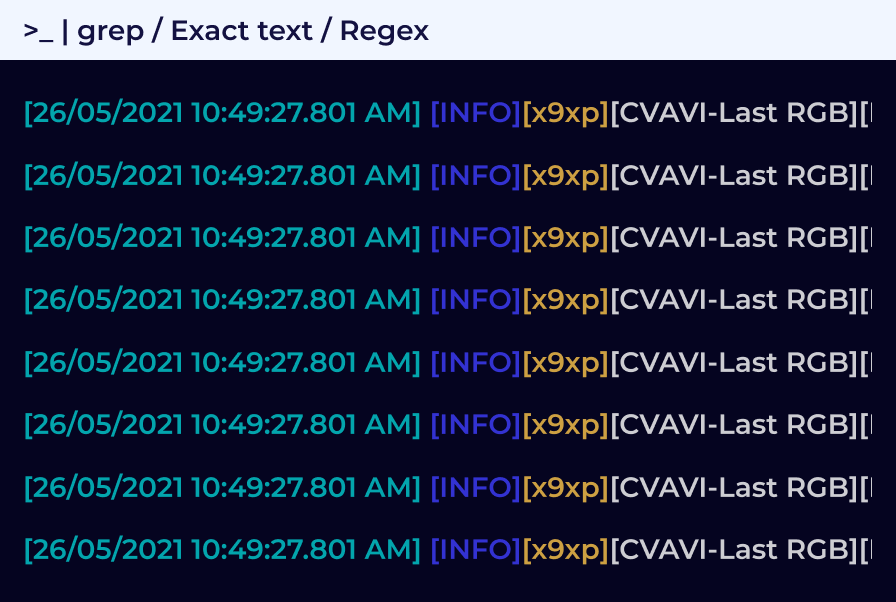
Security Traffic Analyzer (STA)
All event data from all servers can be monitored in Coralogix’s UI or in your own terminal via CLI with less than a 5-second latency. Events in the live tail can be filtered by app or subsystem or according to any |grep/text/regex query.
Dynamic Alerting
All streaming analytics are available per specifically defined user groups and permissions.
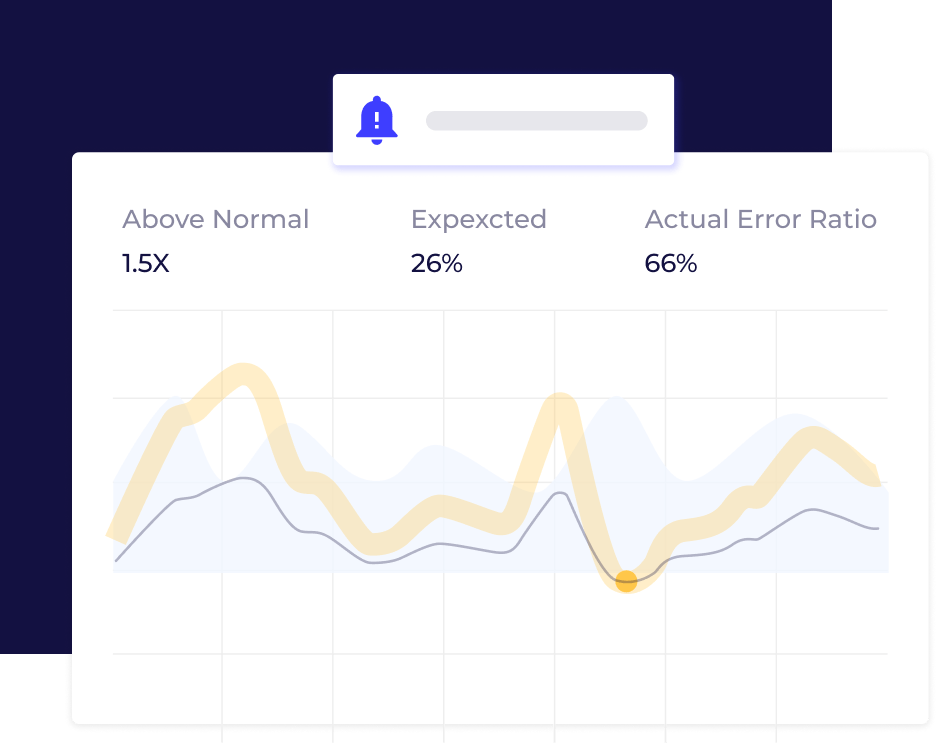
Metric Generation
Machine learning algorithms learn the typical flow of data and identify suspected errors based on correlated events, including abnormal spikes and log ratios.
Live Event Monitoring
Event data is seamlessly collected from hundreds of sources for a single, aggregated view of system health.

Full RBAC
Event enrichment sources are ingested and correlated with event data to ensure that all pertinent information is collected.
Automated Insights
Third-party data sources such as status pages, cloud availability reports, CI/CD platforms & more are leveraged to provide context around how they affect your production.
Data Forwarding
Data can be sent to external long-term storage in readable TSV format that can be also directly queried from Coralogix. Archived event data can be reindexed via direct query at any time.
Visualization & Alerting
All events, aggregations, and insights can be sent for visualization in our purpose-built UI, Kibana, Grafana, SQL clients, Tableau, and more.
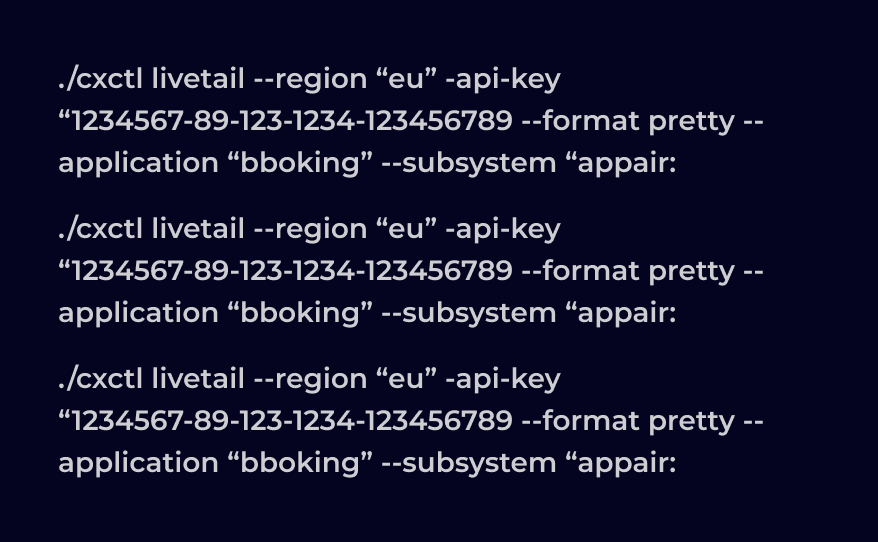
APIs / CLI
Using the Coralogix CLI and full API support, events data can easily be exported to any third-party tool or external location.